
Table of contents:
- Unpaid cost to society from fossil CO2 released from UK incinerators
- UK incineration capacity
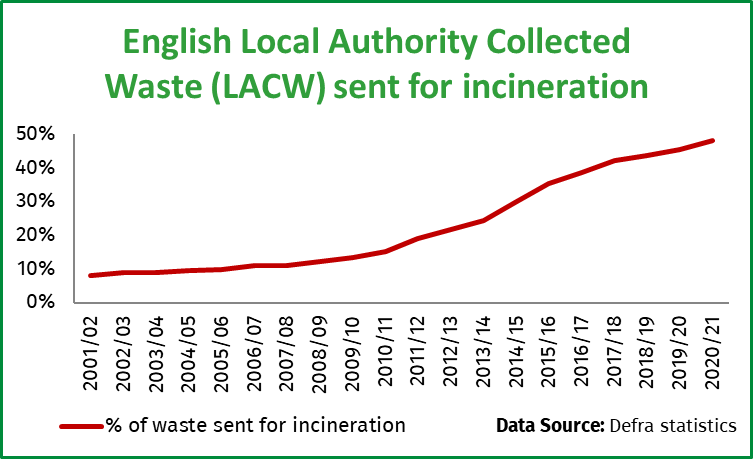
- Local Authority Collected Waste (LACW) sent for incineration in England
- Regional Local Authority Collected Waste (LACW) incineration and recycling rates
- Residual waste recyclability based on compositional analysis
- Fossil CO2 released per tonne of plastic incinerated
Unpaid cost to society from fossil CO2 released from UK incinerators
Incinerators emit large quantities of CO2, roughly one tonne of CO2 for every tonne incinerated. About half of this CO2 derives from fossil sources such as plastic. For decades incinerators have been releasing harmful greenhouse gas (GHG) emissions without compensating society for the associated harm that this has caused. In June 2011 Defra acknowledged (in their Economics of Waste and Waste Policy publication) that incinerators were “creating GHG emissions without paying the relevant price”. Unlike power stations, waste incinerators are not currently part of the Emissions Trading Scheme, and therefore the relevant BEIS carbon prices to use are those for non-traded carbon. There are plans for incinerators in the UK to be included in the UK ETS from 2028.
| Year | Waste incinerated (tonnes) | Fossil CO2 (tonnes) | Central carbon value | Total cost to society of fossil CO2 from incineration |
| 2020 | 14,069,000 [a] | 6,690,000 [a] | £253 [b] | £1,693,841,767 [c] |
| 2021 | 14,846,000 [a] | 6,910,000 [a] | £257 [b] | £1,776,186,385 [c] |
| 2022 | 15,323,000 [a] | 6,690,000 [a] | £261 [b] | £1,745,823,667 [c] |
| 2023 | 16,120,000 [a] | 7,390,000 [a] | £265 [b] | £1,957,863,756 [c] |
| 2024 | 16,820,000 [a] | 7,630,000 [a] | £269 [b] | £2,052,231,436 [c] |
Sources / calculations: [a] 2024 UK EfW Statistics, [b] Green Book supplementary guidance: valuation of energy use and greenhouse gas emissions for appraisal (DESNZ, November 2023) – value shown is rounded to nearest pound but full precision is used for calculation, [c] Tonnes of fossil CO2 multiplied by central carbon price.
UK incineration capacity
As we get closer to achieving our recycling targets there is increasingly less ‘residual’ waste available to burn, but more incineration capacity is continuing to be built. As such, the UK already faces incineration overcapacity, with more incineration capacity than genuinely residual waste available to burn. Despite this, there are dozens of proposals for new incinerators in the UK (see map/table) which, if built, would exacerbate overcapacity and come at the expense of opportunities to improve recycling. These facts underpin calls for a moratorium on new waste incineration capacity in the UK.
Incinerator count by region as of 7 July 2026 (Source: UKWIN records)
| Nation | In Construction | Operational | Grand Total |
|---|---|---|---|
| England | 10 | 53 | 63 |
| Northern Ireland | 1 | 1 | |
| Scotland | 2 | 10 | 12 |
| Wales | 2 | 2 | |
| Total (UK) | 12 | 66 | 78 |
Incineration capacity by region as of 7 July 2026 (Source: UKWIN records)
| Nation | In Construction | Operational | Grand Total |
|---|---|---|---|
| England | 5,076,847 | 17,546,858 | 22,623,705 |
| Northern Ireland | 144,000 | 144,000 | |
| Scotland | 565,000 | 1,876,715 | 2,441,715 |
| Wales | 657,000 | 657,000 | |
| Total (UK) | 5,641,847 | 20,224,573 | 25,866,420 |
UK-wide capacity and count as of December 2025 (Source: Refynix/Tolvik)
| Status | Number of Incinerators | Headline Incineration Capacity |
| Fully Operational | 64 facilities | 19.89 million tonnes |
| In Construction / Commissioning | 11 facilities + Edmonton Rebuild | 5.14 million tonnes |
| Total | 75 facilities | 25.03 million tonnes |
Source for data: 2025 EfW Statistics (Refynx/Tolvik, May 2026) – Excludes cement kilns and clinical waste incinerators. Also excludes current/former biomass plants that treat municipal waste.
Waste management in England
English Regional Local Authority Collected Waste (LACW) incineration and recycling rates in 2020/21

- The Eastern and South West regions had the lowest rates of incineration (30% and 43%) and the highest recycling rates (46% and 48%)
- London had the highest rate of incineration (64%) and the lowest rate of recycling (30%).
- In 6 of the 9 regions, councils are burning more than they recycle.
- In 8 of the 9 regions, to achieve a 65% recycling rate for Local Authority Collected Waste the proportion sent for incineration would need to decrease (yet new incinerators are being built and even more are being proposed).
| Region | Incineration Rate | Recycling Rate | Incineration rate exceeds 35%? | Incineration exceeds recycling? | Incineration above average? | Recycling below average? |
| Eastern | 30% | 46% | ||||
| South West | 43% | 48% | Yes | |||
| East Midlands | 43% | 41% | Yes | Yes | Yes | |
| North West | 44% | 45% | Yes | |||
| South East | 49% | 45% | Yes | Yes | Yes | |
| Yorkshire and the Humber | 51% | 42% | Yes | Yes | Yes | |
| West Midlands | 55% | 38% | Yes | Yes | Yes | Yes |
| North East | 56% | 34% | Yes | Yes | Yes | Yes |
| London | 64% | 30% | Yes | Yes | Yes | Yes |
| England | 48% | 41% | Yes | Yes | Yes | Yes |
Sources Table 2a of local authority collected waste generation from April 2000 to March 2021 (England and regions) and local authority data April 2020 to March 2021 (Defra, January 2022)
Further resources:
- ‘Moving away from incineration towards a circular economy: Policy suggestions for England’s Green Recovery’ (UKWIN, November 2020)
- ‘Stop, Sort, Burn, Bury – incineration in the waste hierarchy: independent review’ (May 2022)
Residual waste recyclability based on compositional analysis
Much of what is incinerated is not genuinely residual waste, but rather valuable material that could and should have been recycled or composted. Compositional analysis studies show that there are many instances where the majority (i.e. over 50%) of ‘waste’ collected at the kerbside could have been recycled or composted had it been put into the correct bin. And this does not even take account of the opportunities for Councils to extend the range of materials they accept for recycling at the kerbside.
The vast majority of incinerators in the UK have no facility to remove recyclable material prior to incineration, and so all of the recyclable and compostable material delivered ends up in the incinerator. Difficult-to-recycle materials are increasingly being redesigned or phased out, meaning incinerators are becoming increasingly reliant upon burning recyclable and compostable material.
Regional and National Compositional Analysis
| Area | Scope | Year | Result |
| Scotland | Kerbside Residual | 2021-2023 | “Approximately 550,000 tonnes, or 52%, of residual waste is made up of waste types that can typically be recycled at the kerbside in Scotland… Data for wastes that are not typically targeted for recycling at the kerbside are not presented in this report… Examples of waste types not targeted at the kerbside include clothing and textiles, which are more commonly collected at bring banks, and waste electrical and electronic equipment (WEEE) which is more commonly collected at household waste recycling centres” |
| Wales | Kerbside Residual | 2022 | “The proportion of kerbside residual waste which was widely recyclable was 36.5%. On average 24.7% of the kerbside residual waste analysed was food waste, while 11.8% consisted of widely recycled dry recycling materials….The proportion of the widely recycled dry recycling materials within the residual waste streams has reduced since 2015, due to good kerbside capture rates achieved for the main dry recycling materials.. In this context, widely recycled dry recycling materials include glass bottles and jars, plastic bottles, pots, tubs and trays, metal tins and cans, paper, and card. They exclude cartons, textiles, batteries, film and small WEEE as these are not consistently collected at the kerbside by all local authorities in Wales.” |
| Wales | C&I Residual | 2019 | “The majority of the [residual C&I] waste analysed (74.5% (+/- 2.4%) or 450,478 tonnes annually) could have potentially been recycled.” |
| England | Household Residual | 2017 | “Of total residual waste from household sources in England in 2017, an estimated 53% could be categorised as readily recyclable, 27% as potentially recyclable, 12% as potentially substitutable and 8% as difficult to either recycle or substitute.” |
| UK | Municipal Waste | 2017 | “Some recyclable materials are still found in household waste, meaning there are opportunities to increase recycling further.” |
| Northern Ireland | Kerbside Residual | 2017 | “The study estimates that 55% of the contents of the residual bin is made up of waste types that could commonly be recycled at the kerbside” |
| Wales | Kerbside Residual | 2015 | “In the kerbside collected residual waste stream, 48.9% of the material was widely recyclable” |
| Scotland | Kerbside Residual | 2014 -2015 | 71% of the residual waste was material typically recyclable at the kerbside or household waste recycling centres: “59% of the 1.13 million tonnes of residual waste is made up of waste types that are typically recycled at the kerbside in Scotland…Of the remaining 41% of residual waste in Figure 3, we estimate that 130,000 [12%] tonnes could have been recycled at household waste recycling centres, bottle banks and similar (e.g clothing and textiles, construction wastes)” |
| North West of England | Landfilled C&I | 2009 | “…the recorded data suggests that up to 97.5% of the C&I waste landfilled in the [North West] region could be recycled if the correct facilities and services were available” |
| Scotland | Total MSW | 2009 | “The findings from this study suggest approximately three quarters (76%) of MSW in Scotland is made up of potentially recyclable and compostable material.” |
| Wales | C&I Residual | 2007 | “2007, when the proportion which could potentially have been recycled was 77% and an estimated 530,000 tonnes of recyclable materials were going to landfill.” |
See also: Northern Ireland Kerbside Waste Composition 2017 on a per-authority basis (WRAP, April 2018)
Local Authority Compositional Analysis of Kerbside Waste
Councils in England unless otherwise stated. Year relates to the survey year (where available) rather than the year of analysis publication.
| Area | Year | % Recyclability of residual waste at kerbside (by weight) |
| West London Waste Authority | 2023 | “c.60% of the waste collected in residual waste containers across the area have alternative household collections available through Food waste, Dry Mixed Recycling (DMR), Green waste and on demand textile/e-waste collection services.” |
| Torbay | 2022 | “58% of residual waste collected could have been recycled alternatively at the kerbside…Around 62.9%…of residual waste is potentially recyclable if a full range of materials were offered by Torbay” |
| East Dunbartonshire, Scotland | 2022 | “64.3% was made up of material with recycling routes available within the authority” |
| Flintshire, Wales | 2022 | “58% of the contents of the residual waste bin (black bin) are materials that could be recycled either at the kerbside or at the household recycling centres. The remaining 42% are items that are not currently recyclable” |
| Lewisham (London Borough) | 202-21 | “57.7% of residual waste collected could have been recycled alternatively at the kerbside” |
| Watford (London Borough) | 2019 | “43.9% of residual waste collected could have been recycled alternatively at the kerbside” (29% dry recyclables, 71% food and garden waste) |
| Greater Manchester | 2018-2019 | “42.6% of residual waste consists of materials that can be recycled at the kerbside…Around 4% of residual waste should be in the pulpable recycling bins, 4% should be in co-mingled recycling bins and 34% should be in organic recycling bins. “ |
| Torbay | 2017 | “52.9% of the residual waste surveyed across Torbay was of a type that could have been recycled by current schemes” |
| North London Waste Authority | 2016 | “approximately 61% of NLWA area’s residual waste stream consists of materials which are widely recyclable at the kerbside” |
| Merseyside and Halton | 2015-16 | 63% potentially recyclable (and 4.6% of the total kerbside waste was potentially usable, primarily textiles followed by WEEE) |
| Newcastle upon Tyne | 2016 | ~50%+ (extrapolated from metals recycling vs remaining metals extracted through MBT) |
| St. Albans (Hertfordshire) | 2015 | 65.78% |
| Barnet | 2014-2015 | 58.6%-46.1% for flats (pre/post campaign) |
| Barnet | 2014-2015 | 56.8% |
| Hertfordshire | 2015 | 51.2% |
| South Gloucestershire | 2014-15 | 52% (and a further 10.1% through other existing services) |
| Warwickshire | 2014 | 57.9% |
| Three Rivers | 2012 | 54.1% |
| Bournemouth | 2008-9 | 75%+ |
Sources: Local Authority composition analysis (see above for links)
Fossil CO2 released per tonne of plastic incinerated
Incinerators burn plastic and so they are reliant upon fossil fuel (as most plastics are made from crude oil). The small amount of energy produced by incinerators is generated inefficiently and comes at a high climate cost (see above).
When carbon (C) is incinerated it is combined with oxygen (O) which turns it into CO2. One can convert carbon content (% Carbon) to Fossil CO2 by multiplying by 44/12 (3.6667). Thus, to derive the CO2 release by the incineration of one tonne of Dense Plastic (which has a carbon content of 54.8%) one multiplies 0.548 by 3.6667 to get around 2.01 tonnes of Fossil CO2.
| Type | % Carbon | Fossil CO2 released per tonne of plastic incinerated |
| Plastic Film | 47.8% | 1.753 tonnes of Fossil CO2 |
| Dense Plastic | 54.8% | 2.01 tonnes of Fossil CO2 |